


























 vs Arizona State · Wk 3Win prob 40%Model +4.2
Schedule & Results
 MIZMissouriL21-38✓Wk 3vsASUArizona State+4.240%Wk 5vs
 MTSUMiddle Tennessee-17.086%Wk 6@
 UTAHUtah+15.717%Wk 7@
 KSUKansas State+10.726%Wk 8vs
 BAYBaylor+1.346%Wk 9@
 TCUTCU+5.137%Wk 10vs
 UCFUCF-3.458%Wk 11@
 WVUWest Virginia-2.657%Wk 12vs
 BYUBYU+17.912%Wk 13@
 OKSTOklahoma State-0.653%
Team Leaders
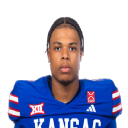 Isaiah MarshallPassing414 yds · 4 TD · 2 INT
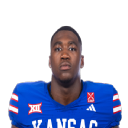 Yasin WillisRushing90 yds · 2 TD · 4.7 avg
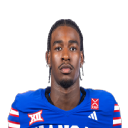 Nik McMillanReceiving8 rec · 182 yds · 2 TD
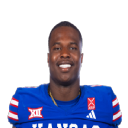 Trey LathanTackles12 tackles · 1.5 TFL · 1 sacks
Latest on Kansas
All news →Kansas's explosive plays are Missouri's one real vulnerability
Isaiah Marshall had a hand in eight of Kansas's twelve explosive plays
Neal Runs Wild as Kansas Buries Colorado at Arrowhead
Colorado at Kansas: A Coin Flip That Leans Buffalo
Roster · 114 players
| # | Player | Pos | Cl | Ht | Wt | Hometown |
|---|---|---|---|---|---|---|
| 8 | Isaiah Marshall | QB | SO | 6'0" | 210 | Southfield, MI |
| 10 | Chase Jenkins | QB | JR | 6'0" | 195 | Houston, TX |
| 15 | Cole Ballard | QB | JR | 6'2" | 220 | Westfield, IN |
| 16 | Jaylen Mason | QB | FR | 6'2" | 200 | Wichita, KS |
| 18 | Braylen Rooney | QB | FR | 6'5" | 230 | Phoenix, AZ |
| 20 | Connor Hanika | QB | FR | 6'2" | 200 | Topeka, KS |
| 1 | Dylan Edwards | RB | JR | 5'9" | 175 | Derby, KS |
| 2 | Kory Amachree | RB | FR | 6'0" | 210 | Haslett, MI |
| 4 | Jalen Dupree | RB | SO | 6'0" | 215 | Benton, AR |
| 6 | Yasin Willis | RB | JR | 6'1" | 230 | Newark, NJ |
| 22 | Micah Johnson | RB | SO | 5'10" | 195 | Wichita, KS |
| 24 | John Kelly | RB | FR | 6'1" | 205 | Cypress, TX |
| 25 | Justin Thurman | RB | FR | 6'0" | 200 | Tampa, FL |
| 30 | Jack Reeves | RB | FR | 6'0" | 205 | Prairie Village, KS |
| 0 | Nahzae Cox | WR | SR | 6'3" | 215 | Fresno, CA |
| 3 | Keaton Kubecka | WR | JR | 6'2" | 205 | Austin, TX |
| 5 | Nik McMillan | WR | SR | 6'1" | 195 | Buffalo, NY |
| 7 | Cam Pickett | WR | SR | 6'0" | 195 | Chicago, IL |
| 11 | Tate Nagy | WR | SO | 5'10" | 170 | Overland Park, KS |
| 12 | Bryson Hayes | WR | FR | 6'0" | 190 | Wichita, KS |
| 13 | Nate Sims | WR | FR | 6'1" | 185 | Ottawa, KS |
| 17 | Tyren Parker | WR | FR | 6'3" | 195 | Topeka, KS |
| 19 | Corbin Glasco | WR | FR | 5'9" | 185 | Denton, TX |
| 23 | AJ Batiste | WR | FR | 6'1" | 185 | Wichita, KS |
| 80 | Griffin Baker | WR | FR | 6'3" | 195 | Wichita, KS |
| 82 | Isreal Moses V | WR | JR | 6'2" | 205 | Minneapolis, MN |
| 86 | Donald Collier | WR | SO | 5'10" | 195 | Andover, KS |
| 89 | Jackson Cook | WR | FR | 6'2" | 195 | Loganville, GA |
| 9 | Jailen Butler | TE | SR | 6'4" | 250 | Chicago, IL |
| 14 | Mikey Pauley | TE | SR | 6'5" | 245 | Overland Park, KS |
| 35 | Jack Utz | TE | FR | 6'5" | 235 | Kansas City, MO |
| 44 | Carson Bruhn | TE | SO | 6'6" | 260 | Sioux Center, IA |
| 81 | Quinton Conley | TE | SR | 6'6" | 245 | Kansas City, MO |
| 83 | Conlee Hovey | TE | FR | 6'5" | 250 | Louisburg, KS |
| 85 | Carter Moses | TE | SR | 6'5" | 245 | Wilmington, NC |
| 87 | Leyton Cure | TE | SR | 6'3" | 250 | Goodland, KS |
| 88 | Kevin Sullivan | TE | FR | 6'6" | 245 | Kansas City, MO |
| 51 | Kasen Carpenter | OL | JR | 6'3" | 310 | Allen, TX |
| 52 | Nick Morrow | OL | JR | 6'8" | 330 | Flagstaff, AZ |
| 53 | Kaden Moody | OL | FR | 6'6" | 310 | Broken Arrow, OK |
| 54 | Tavake Tuikolovatu | OL | JR | 6'6" | 325 | Wailuku, HI |
| 55 | Trezelle Jenkins Jr. | OL | SO | 6'6" | 310 | Detroit, MI |
| 56 | Amir Herring | OL | JR | 6'3" | 310 | Southfield, MI |
| 58 | Marco Mohajir | OL | FR | 6'1" | 275 | Orlando, FL |
| 64 | Kaden Snyder | OL | FR | 6'6" | 290 | Salina, KS |
| 67 | Eli Richmond | OL | FR | 6'4" | 305 | Paola, KS |
| 68 | Max Manske | OL | FR | 6'3" | 265 | Overland Park, KS |
| 71 | James Livingston | OL | SR | 6'7" | 310 | Dexter, MI |
| 72 | DeAndre Harper | OL | SO | 6'6" | 320 | Omaha, NE |
| 73 | Anderson Kopp | OL | FR | 6'4" | 305 | Phoenix, AZ |
| 74 | Jack Tanner | OL | SO | 6'6" | 315 | Highland Village, TX |
| 75 | Calvin Clements | OL | JR | 6'7" | 325 | Lawrence, KS |
| 76 | Antonio Wilson | OL | JR | 6'6" | 320 | Orlando, FL |
| 77 | Malachi Mills | OL | FR | 6'5" | 305 | Carmel, IN |
| 78 | Brandon Solis | OL | JR | 6'7" | 315 | Nashville, TN |
| 79 | Connor Stroh | OL | JR | 6'7" | 350 | Frisco, TX |
| 9 | Dakyus Brinkley | DE | SO | 6'3" | 255 | Katy, TX |
| 33 | Leroy Harris III | DE | JR | 6'5" | 270 | Brentwood, TN |
| 44 | David Santiago | DE | JR | 6'4" | 255 | Raleigh, NC |
| 45 | Garrett Martin | DE | FR | 6'4" | 250 | Scottsdale, AZ |
| 50 | Wyatt Brungardt | DE | FR | 6'5" | 240 | Wellsville, KS |
| 53 | Draeden Punt | DE | FR | 6'7" | 250 | Orange City, IA |
| 90 | Adrian Holley | DE | FR | 6'4" | 255 | Westville, IN |
| 91 | Alex Bray | DE | SR | 6'4" | 265 | Chesterfield, MO |
| 97 | Hunter Higgins | DE | FR | 6'5" | 265 | Wichita, KS |
| 70 | Jason Strickland | DL | SO | 6'3" | 270 | Olathe, KS |
| 56 | Marcus Calvin | DT | JR | 6'2" | 305 | Saint Petersburg, FL |
| 71 | Grady Seyfert | DT | JR | 6'1" | 300 | Beloit, KS |
| 88 | Kevin Oatis | DT | FR | 6'3" | 305 | Hattiesburg, MS |
| 92 | Nakwaine Carter | DT | FR | 6'1" | 290 | Oklahoma City, OK |
| 93 | Josiah Hammond | DT | FR | 6'4" | 290 | Tulsa, OK |
| 94 | Blake Herold | DT | JR | 6'3" | 300 | Shenandoah, IA |
| 95 | Tre'von McAlpine | DT | SR | 6'3" | 310 | Saraland, AL |
| 96 | Jibriel Conde | DT | JR | 6'5" | 300 | Ypsilanti, MI |
| 98 | Jalen Atkins | DT | SO | 6'3" | 285 | Wagoner, OK |
| 99 | Eamon Smalls | DT | JR | 6'2" | 335 | Beaufort, NC |
| 4 | Trey Lathan | LB | SR | 6'1" | 230 | Goulds, FL |
| 7 | Bam Crouch | LB | SR | 6'1" | 225 | Tampa, FL |
| 8 | Josh Galbreath | LB | FR | 6'3" | 225 | Lawrence, KS |
| 11 | Malachi Curvey | LB | FR | 6'4" | 245 | Waukee, IA |
| 13 | Quincy Davis | LB | JR | 6'1" | 230 | Las Vegas, NV |
| 14 | Jaron Willis | LB | SR | 6'2" | 235 | Albany, GA |
| 18 | Joseph Credit | LB | FR | 6'1" | 220 | Pearland, TX |
| 25 | Jibreel Al-Amin | LB | SR | 6'3" | 225 | Woodbridge, VA |
| 30 | Parker Schwarz | LB | FR | 6'1" | 230 | La Cygne, KS |
| 32 | Xander Blasing | LB | FR | 6'2" | 230 | Topeka, KS |
| 41 | Ezra Vedral | LB | JR | 6'2" | 225 | Omaha, NE |
| 59 | Jett Kohanzo | LB | FR | 6'2" | 220 | Barrington, IL |
| 0 | Austin Alexander | CB | SO | 6'0" | 190 | Hazel Crest, IL |
| 1 | Jalen Todd | CB | JR | 6'1" | 195 | Southfield, MI |
| 2 | Syeed Gibbs | CB | SR | 6'0" | 195 | Everett, MA |
| 5 | Roman Pearson | CB | SR | 6'2" | 205 | Pickerington, OH |
| 6 | Jahlil Hurley | CB | JR | 6'2" | 185 | Florence, AL |
| 10 | Elijah Cannon | CB | SO | 6'0" | 190 | Coconut Creek, FL |
| 17 | Trey Brown | CB | FR | 6'0" | 190 | Carson, CA |
| 19 | Chris McCorkle | CB | FR | 6'1" | 185 | Bradenton, FL |
| 26 | Robert Reddick | CB | FR | 6'2" | 185 | Indianapolis, IN |
| 36 | Jameer Moore | CB | SO | 6'3" | 200 | Salina, KS |
| 3 | Corey Gordon | S | SR | 6'2" | 205 | Oklahoma City, OK |
| 12 | Jaden Harris | S | SR | 6'0" | 205 | Atlanta, GA |
| 16 | Brandon Schmelzle | S | FR | 6'2" | 210 | Axtell, KS |
| 20 | Christian Pritchett | S | JR | 6'2" | 200 | Harvey, LA |
| 22 | Khijohnn Cummings-Coleman | S | SO | 5'11" | 200 | Minneapolis, MN |
| 23 | Mason Ellis | S | SR | 6'2" | 200 | Mulvane, KS |
| 24 | Darrion Jones | S | FR | 6'3" | 190 | Fort Myers, FL |
| 27 | Taylor Davis | S | JR | 6'0" | 205 | Missouri City, TX |
| 34 | Dillon Marshall | S | SO | 6'2" | 205 | Overland Park, KS |
| 40 | Colter McDaniel | S | SO | 6'2" | 190 | Cheney, KS |
| 29 | Martin Connington | PK | SO | 6'0" | 200 | Meridian, ID |
| 98 | Dane Efird | PK | FR | 6'3" | 200 | Branson, MO |
| 33 | Ben Shipley | P | FR | 6'5" | 200 | Houston, TX |
| 99 | Matthew Gill | P | FR | 6'3" | 195 | Sydney, NSW |
| 39 | Rino Monteforte | LS | SR | 5'7" | 210 | North Babylon, NY |
| 49 | Hollis Moeller | LS | SO | 6'0" | 220 | Shawnee, KS |
Team Statistics · per game, with national FBS rank
Rank is national among all FBS teams (#1 = best), oriented so higher rank = better even for defensive and discipline metrics. Bars show percentile.
Scouting Report · 2026 projection
Kansas runs it: Lance Leipold's offenses have been run-leaning across 11 seasons. The strengths are offensive, led by 6th in the push up front. The way in is 131st at keeping everything in front of them, and they are 126th at hitting chunk plays.
On fourth down he goes for it about as often as his peers do from the same spots (+0.1%). Against what the expected-points model recommends he is −25.9% — the profession as a whole is negative on this.
Kansas has played 2 games against a soft slate, adjusted for here. That football carries about 0% of what is below; the rest is still the preseason projection.
Projected strengths
- Offensethe push the line gets#6projected
- Offensemoving the ball on the ground#23projected
- Offensefirst and second down#32projected
Projected soft spots
- Defensehitting chunk plays#131projected
- Offensehitting chunk plays#126projected
Each bar is where this team sits in the country. Before the season has produced enough football these are PROJECTIONS — last season regressed to the mean, plus talent, returning production, recruiting and whether the staff is the same one — and the season replaces them as it is played. Head coaches only — there is no free feed for coordinators, so on a program where the head coach does not call the offense this describes the staff he hired. Play-calling identity is a style, not a grade: throwing more than the situations warrant is not better than throwing less than they warrant.
2026 Season Projection
model win prob · 10 to playHow the season could finish · 2026 · chance of each final win total · 10 games left
Every remaining game simulated from the model's win probability for it. Tallest bar is the single likeliest finish, not a prediction that it happens.
Player Value
EPA contribution by position group + estimated NIL market value (derived from position rates and on-field production — not actual deal figures).
Total EPA produced by each positional group this season. OL value is captured via the rush/pass efficiency of skill players; OL-specific EPA isn't separately reported.
Estimated from position-group market rates and on-field EPA contribution. Actual NIL valuations depend on social media following, brand fit, and market negotiations — these figures are directional only.
The Five Factors
ranked vs. FBS · bar = betterOpponent-adjusted efficiency
EPA/play vs. schedulePass vs. rush (PPA)
Trenches & disruption
- Line yards (off)
- 2.87#97
- 2nd-level / open-field
- 0.95 / 0.63
- Power / stuff (off)
- 66.7% / 12.5%
- Havoc — total (def)
- 21.9%#23
- Havoc — front 7 / DB
- 16.4% / 5.5%
Standard vs. passing downs
ProPPA on each down type (off vs. def).
Opponent-adjusted by down
Pro| 1st | 2nd | 3rd | |
|---|---|---|---|
| Offense | 0.07#76 | 0.41#36 | 0.55#67 |
| Defense | -0.06#63 | 0.13#70 | 0.48#90 |
Elo Trajectory
Team Fingerprint · 2026 · 46 opponent-adjusted metrics · percentile vs 138 FBS teams
Plot these →Efficiency
- Offense EPA/play0.3577th
- Defense EPA/play allowed0.0171st
- Offense success rate44%50th
- Defense success rate allowed29%86th
Downs
- Offense success — standard downs47%40th
- Offense success — passing downs37%69th
- Defense success allowed — standard downs32%88th
- Defense success allowed — passing downs26%57th
Explosiveness
- Offense explosiveness1.596th
- Defense explosiveness allowed1.339th
- Offense explosiveness — standard downs1.394th
- Offense explosiveness — passing downs2.380th
Trenches
- Offense line yards2.940th
- Defense line yards allowed1.988th
- Offense highlight yards0.5723rd
- Defense highlight yards allowed0.7248th
- Offense power success0.6328th
- Defense power success allowed1.05th
- Offense stuff rate0.1091st
- Defense stuff rate0.2885th
Third down
- Third down conversion41%42nd
- Third down distance faced8.84th
- Third down conversion allowed32%67th
- Third down distance forced8.073rd
Halves
- Net success rate — first half0.2382nd
- Net success rate — second half0.1162nd
Drives
- Points per drive1.222nd
- Points per drive allowed3.518th
- Average starting field position2842nd
- Opponent starting field position3514th
- Available yards gained28%11th
- Available yards allowed62%22nd
- Scoring opportunities per drive67%21st
- Scoring opportunities allowed85%38th
- Points per scoring opportunity1.821st
- Points allowed per opportunity4.119th
- Three-and-out rate33%32nd
- Three-and-outs forced23%51st
CORE
- CORE offense-6.012th
- CORE defense6.48th
- CORE overall-12.47th
Roster
- Returning usage16%16th
- Returning EPA59.532nd
- Team talent composite68555th
- Recruiting class rank61.056th
- Recruiting class points19756th
Every metric is opponent-adjusted and ranked so that higher is always better — a defensive rate that is good when low is ranked accordingly. Sack and tackle-for-loss composition are deliberately absent: their relationship to team quality is a measured null, so they carry a style rather than a rank, and they appear in the pressure signature instead.
Intelligence Report
Offensive DNA
Pass efficiency edge: 0.299 EPA/play
Defensive Identity
Disruption comes primarily from the front seven.
Season Signature
1-1 record through 2 games.
Team Shape · percentile vs. FBS · dashed = 50th
Each axis = national percentile rank. 100th = best in FBS, 0th = worst. Defense and Havoc are oriented so higher = better.
CORE efficiency · situation and opponent removed
Points per 100 plays above average, after the game state is regressed out of every snap and the schedule is solved out across the whole league. The version of this team’s efficiency that can be compared to a team it never played.
What a possession is worth · 12 drives
Play-calling identity
Against what the league calls from the same down, distance, field position, score and clock — so this is the staff, not the game script.
- Pass rate
- 56.9%
- Expected, given the spots
- 60.2%
- Over expected
- -3.3
- Fourth down vs peers
- +11
- Fourth down vs the model
- +0
National Landscape · 2026 FBS · offense vs. defense EPA/play
Each dot = one FBS team. Kansas is highlighted. Tap or hover a dot for details.
Similar Programs
Teams with the closest offense + defense efficiency profile to Kansas in 2026


Similarity = normalized Euclidean distance on season offensive and defensive EPA/play. Teams within ±0.02 EPA/play on both units score >90%.
Program Trajectory · CORE rating · 2015–2026 · points per game vs an average FBS team
Program History
recent seasons| Year | Overall | Conf | Win % | xW | Luck |
|---|---|---|---|---|---|
| 2026 | 1-1 | 0-0 | 50% | 1.1 | -0.1 |
| 2025 | 5-7 | 3-6 | 42% | 6.7 | -1.7 |
| 2024 | 5-7 | 4-5 | 42% | 7.4 | -2.4 |
| 2023 | 9-4 | 5-4 | 69% | 10.7 | -1.7 |
| 2022 | 6-7 | 3-6 | 46% | 6.9 | -0.9 |
| 2021 | 2-10 | 1-8 | 17% | 1.7 | +0.3 |
| 2020 | 0-9 | 0-8 | 0% | 0.3 | -0.3 |
| 2019 | 3-9 | 1-8 | 25% | 3.9 | -0.9 |
| 2018 | 3-9 | 1-8 | 25% | 2.8 | +0.2 |
| 2017 | 1-11 | 0-9 | 8% | 1.6 | -0.6 |
xW = expected wins from per-game dominance. Luck = actual − expected (positive = won close games).
0-1 so far, projected to finish 5.3-6.7. Wins the Big 12 in 0.8%.
If they finish with…
Their chance of making it at each final loss count. Better than even up to 2.
down 2.6 points since preseason.
- At 2 losses they are 68% where the average Big 12 team is 56%.
- The Big 12 takes 1.77 bids in an average season, and four or more in 1.9%.
Kansas’s own turning points
Points of playoff probability between winning and losing.
- wk6at Utah4.0
- wk7at Kansas State3.2
- wk12vs BYU3.1
- wk9at TCU2.5
- wk13at Oklahoma State2.4
- wk3vs Arizona State2.0
Who to root for
Games Kansas is not in that move its odds most. Same units, much smaller scale.
- wk7South Florida over Kent State0.5
- wk8Cincinnati over Texas Tech0.4
- wk3Colorado State over BYU0.4
- wk4Tulane over Southern Miss0.4
- wk4Virginia over Delaware0.3
- wk3Houston over Texas Tech0.3
Big 12
0-0 in league play, projected 3.4-5.614 of 16 by title oddsThe Big 12 sends its top two by conference winning percentage, head-to-head breaking a tie. The last berth is level on percentage in 46% of simulated seasons, so a tiebreaker decides it about that often.
- wk6Kansas at Utah3.1
- wk12BYU at Kansas2.5
- wk7Kansas at Kansas State2.4
- wk9Kansas at TCU1.9
Points of title probability riding on each result. The whole Big 12 race →
If not the playoff, then
Kansas is 1-1 and needs 5 more wins from 10 games to reach the six that make a team eligible — at most one of which may come against an FCS opponent. In 4.1% of seasons they get there and still go nowhere: there are more eligible teams than seats.
- First Responder Bowl7.1%
- Independence Bowl5.7%
- Rate Bowl5.1%
- Liberty Bowl4.3%
- Xbox Bowl3.8%
- Pop-Tarts Bowl3.3%
Recruiting Pipelines
since 2010Of the 170 high-school programs with a pipeline page here, 5 have sent Kansas a player since 2010 — 8 signees between them. Where they signed, not where they were offered, and not a complete list of Kansas's feeder schools: only these 170 have the outcome history to measure.