

Schedule & Results


Team Leaders
 Anthony ColandreaPassing275 yds · 3 TD · 0 INT
 Jamal RuleRushing122 yds · 2 TD · 8.1 avg
 Mekhi NelsonReceiving2 rec · 65 yds · 1 TD
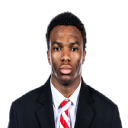 Jamir ConnTackles8 tackles · 1 TFL · 0 sacks
Latest on Nebraska
All news →Bowling Green can't throw on this Nebraska secondary
Anthony Colandrea produced eight of Nebraska's twelve explosive plays
Nebraska's rush defense is Ohio's one real opening
Roster · 117 players
| # | Player | Pos | Cl | Ht | Wt | Hometown |
|---|---|---|---|---|---|---|
| 10 | Anthony Colandrea | QB | SR | 6'0" | 205 | St. Petersburg, FL |
| 12 | Daniel Kaelin | QB | SO | 6'3" | 220 | Elkhorn, NE |
| 14 | TJ Lateef | QB | SO | 6'1" | 200 | Compton, CA |
| 16 | Bode Soukup | QB | SO | 6'2" | 205 | Blair, NE |
| 21 | Kwinten Ives | RB | JR | 6'3" | 215 | Beverly, NJ |
| 22 | Isaiah Mozee | RB | SO | 6'0" | 210 | Kansas City, MO |
| 23 | Conor Booth | RB | FR | 6'0" | 215 | Wahoo, NE |
| 25 | Jamal Rule | RB | FR | 6'0" | 205 | Salisbury, NC |
| 35 | Mekhi Nelson | RB | SO | 6'0" | 195 | Wilkes-barre, PA |
| 2 | Jacory Barney Jr. | WR | JR | 6'0" | 170 | Florida City, FL |
| 4 | Janiran Bonner | WR | SR | 6'2" | 225 | Ellenwood, GA |
| 11 | Demitrius Bell | WR | JR | 6'0" | 195 | Nashville, TN |
| 11 | Kwazi Gilmer | WR | JR | 6'2" | 190 | Los Angeles, CA |
| 13 | Nyziah Hunter | WR | JR | 6'1" | 205 | Salinas, CA |
| 15 | Keelan Smith | WR | SO | 6'3" | 205 | Liberty, MO |
| 17 | Larry Miles | WR | FR | 5'11" | 175 | Winter Garden, FL |
| 18 | Quinn Clark | WR | SO | 6'5" | 210 | Bozeman, MT |
| 19 | Cortez Mills Jr. | WR | SO | 6'0" | 185 | Homestead, FL |
| 24 | Nalin Scott | WR | FR | 6'2" | 210 | Marietta, GA |
| 26 | Roman Mangini | WR | SR | 5'10" | 170 | Mesa, AZ |
| 46 | Connor Schutt | WR | SO | 6'6" | 225 | Wahoo, NE |
| 80 | Jeremiah Jones | WR | FR | 6'4" | 225 | Murray, KY |
| 81 | Hayes Miller | WR | SO | 6'0" | 200 | Shawnee, KS |
| 84 | DJ Singleton Jr. | WR | SO | 5'10" | 150 | Greensburg, LA |
| 84 | DJ Singleton Jr. | WR | SO | 5'10" | 150 | Greensburg, LA |
| 88 | Jackson Carpenter | WR | FR | 6'1" | 200 | Lincoln, NE |
| — | Jamari Brown | WR | FR | 5'11" | 175 | Chicago, IL |
| — | Maurice Purify II | WR | FR | 6'4" | 185 | Omaha, NE |
| 29 | Carter Nelson | TE | JR | 6'5" | 240 | Ainsworth, NE |
| 41 | Luke Sorensen | TE | FR | 6'3" | 240 | Orange County, CA |
| 44 | Luke Lindenmeyer | TE | SR | 6'3" | 250 | La Vista, NE |
| 48 | Cayden Echternach | TE | JR | 6'4" | 260 | Bennington, NE |
| 49 | Danny King | TE | SO | 6'4" | 245 | Bloomington, MN |
| 82 | Eric Ingwerson | TE | SO | 6'7" | 255 | Papillion, NE |
| 51 | Justin Evans | OL | SR | 6'2" | 315 | East Orange, NJ |
| 54 | Brendan Black | OL | SR | 6'4" | 320 | Yulee, FL |
| 55 | Tree Babalade | OL | JR | 6'5" | 330 | Hyattsville, MD |
| 57 | Elijah Pritchett | OL | SR | 6'6" | 325 | Columbus, GA |
| 57 | Ashton Murphy | OL | SO | 6'5" | 275 | Elkhorn, NE |
| 58 | Jake Peters | OL | SO | 6'3" | 300 | Cedar Falls, IA |
| 62 | Sam Sledge | OL | JR | 6'4" | 300 | Omaha, NE |
| 65 | Paul Mubenga | OL | JR | 6'5" | 315 | Buford, GA |
| 66 | Grant Brix | OL | SO | 6'6" | 315 | Logan, IA |
| 68 | Preston Taumua | OL | SO | 6'4" | 325 | Waipahu, HI |
| 70 | Nolan Fennessy | OL | SO | 6'4" | 300 | Norfolk, NE |
| 71 | Claude Mpouma | OL | FR | 6'8" | 260 | Chicago, IL |
| 72 | Gibson Pyle | OL | SO | 6'5" | 295 | Houston, TX |
| 74 | Brock Knutson | OL | JR | 6'7" | 310 | Scottsbluff, NE |
| 75 | Tyler Knaak | OL | SR | 6'6" | 325 | Cottonwood Heights, UT |
| 76 | Rex Waterman | OL | FR | 6'5" | 295 | Chandler, AZ |
| 77 | Gunnar Gottula | OL | JR | 6'6" | 305 | Lincoln, NE |
| 78 | Jacob Brandl | OL | JR | 6'3" | 305 | Omaha, NE |
| 79 | Shawn Hammerbeck | OL | FR | 6'6" | 265 | Hamill, SD |
| — | Hayden Ainsworth | OL | FR | 6'5" | 285 | Biloxi, MS |
| 11 | Cameron Lenhardt | EDGE | SR | 6'3" | 270 | Staten Island, NY |
| 15 | Anthony Jones Jr. | EDGE | SR | 6'5" | 265 | Las Vegas, NV |
| 17 | Willis McGahee IV | EDGE | SO | 6'1" | 240 | Miami, FL |
| 55 | Ethan Duda | EDGE | SO | 6'5" | 250 | Omaha, NE |
| 93 | Kade Pietrzak | EDGE | SO | 6'5" | 265 | West Fargo, ND |
| 94 | Jordan Ochoa | EDGE | SO | 6'4" | 240 | Castle Rock, CO |
| 96 | Williams Nwaneri | EDGE | SO | 6'7" | 265 | Lee's Summit, MO |
| 97 | Mac Markway | EDGE | JR | 6'4" | 250 | St. Louis, MO |
| 98 | Conor Connealy | EDGE | JR | 6'4" | 260 | Elkhorn, NE |
| 5 | Riley Van Poppel | DT | JR | 6'5" | 295 | Argyle, TX |
| 34 | Owen Stoudmire | DT | SR | 6'1" | 290 | Creston, OH |
| 39 | David Hoffken | DT | SO | 6'7" | 285 | Kiel |
| 44 | Jahsear Whittington | DT | SO | 6'0" | 270 | Philadelphia, PA |
| 49 | Malcolm Simpson | DT | FR | 6'3" | 285 | Hitchcock, TX |
| 69 | Landen Davidson | DT | SO | 6'4" | 305 | Broomfield, CO |
| 71 | Tyson Terry | DT | FR | 6'2" | 310 | Omaha, NE |
| 86 | Mason Goldman | DT | JR | 6'5" | 270 | Gretna, NE |
| 92 | Sua Lefotu | DT | JR | 6'3" | 300 | Bellflower, CA |
| 95 | Gabe Moore | DT | JR | 6'5" | 290 | Louisville, MS |
| 99 | Dylan Parrott | DT | SR | 6'5" | 320 | Eldridge, IA |
| — | Dylan Berymon | DT | FR | 6'2" | 330 | Monroe, LA |
| 9 | Vincent Shavers Jr. | LB | JR | 6'1" | 225 | Miami, FL |
| 24 | Dexter Foster | LB | JR | 6'3" | 235 | Portland, OR |
| 30 | Vincent Genatone | LB | SR | 6'0" | 225 | North Platte, NE |
| 32 | Trent Uhlir | LB | SO | 6'1" | 235 | Battle Creek, NE |
| 33 | Owen Chambliss | LB | JR | 6'3" | 230 | Corona, CA |
| 35 | Christian Jones | LB | FR | 6'2" | 235 | Elkhorn, NE |
| 40 | Dawson Merritt | LB | SO | 6'3" | 225 | Stilwell, KS |
| 42 | Derek Wacker | LB | SO | 6'1" | 230 | Yutan, NE |
| 43 | Will Hawthorne | LB | FR | 6'2" | 225 | Ames, IA |
| 45 | Dylan Rogers | LB | JR | 6'3" | 240 | Cypress, TX |
| 47 | Gage Stenger | LB | SR | 6'2" | 220 | Omaha, NE |
| 54 | Jacob Bower | LB | JR | 6'1" | 220 | Rancho Santa Margarita, CA |
| 56 | Pierce Mooberry | LB | FR | 6'3" | 220 | Omaha, NE |
| — | Jase Reynolds | LB | FR | 6'2" | 200 | Elkhorn, NE |
| 10 | Andrew Marshall | CB | SR | 6'0" | 190 | Eastvale, CA |
| 14 | Amare Sanders | CB | SO | 6'1" | 190 | Miami, FL |
| 16 | Danny Odem III | CB | FR | 6'0" | 175 | Farrell, PA |
| 18 | Larry Tarver Jr. | CB | SO | 5'11" | 175 | Miami, FL |
| 19 | Kahmir Prescott | CB | SO | 6'1" | 195 | Philadelphia, PA |
| 22 | Victor Evans III | CB | SR | 6'1" | 180 | Miami, FL |
| 23 | Blye Hill | CB | JR | 6'4" | 195 | Baltimore, MD |
| 25 | Jeremiah Charles | CB | JR | 6'0" | 175 | Arlington, TX |
| 29 | Braylen Prude | CB | SO | 6'4" | 200 | Pearland, TX |
| 31 | Mario Buford | CB | SO | 6'0" | 185 | Desoto, TX |
| 37 | Donovan Jones | CB | SO | 6'1" | 200 | Omaha, NE |
| 39 | Bryson Webber | CB | FR | 6'3" | 190 | Missouri City, TX |
| 12 | Justyn Rhett | S | JR | 6'1" | 200 | Las Vegas, NV |
| 13 | Jamir Conn | S | SR | 5'11" | 180 | Kansas City, MO |
| 21 | Rex Guthrie | S | SO | 6'1" | 200 | Littleton, CO |
| 23 | Caleb Benning | S | SO | 5'11" | 200 | Omaha, NE |
| 26 | Dwayne McDougle III | S | SR | 5'11" | 210 | Oakland, CA |
| 30 | Jasin Shiggs | S | JR | 6'1" | 180 | Newark, NJ |
| 36 | Rowdy Bauer | S | SO | 5'11" | 195 | Norfolk, NE |
| 38 | Thomas D'Onofrio | S | SO | 6'1" | 185 | Middleton, WI |
| 41 | Tanner Terch | S | FR | 6'1" | 190 | Littleton, CO |
| 84 | Michael Sarikizis | PK | FR | 5'10" | 190 | Melbourne, VIC |
| 90 | John Hohl | PK | JR | 6'0" | 195 | Lincoln, NE |
| 91 | Kyle Cunanan | PK | JR | 5'10" | 180 | Phoenix, AZ |
| 37 | Kamdyn Koch | P | SO | 6'2" | 200 | Westminster, MD |
| 83 | Archie Wilson | P | SO | 6'2" | 215 | Frankston, VIC |
| 87 | Jack Wills | LS | SO | 6'2" | 220 | Hudsonville, MI |
| — | Kyson Gana | LS | FR | 6'1" | 170 | Hickman, NE |
Team Statistics · per game, with national FBS rank
Rank is national among all FBS teams (#1 = best), oriented so higher rank = better even for defensive and discipline metrics. Bars show percentile.
Scouting Report · 2026 projection
Nebraska is in year 4 under Matt Rhule, whose offenses have been balanced. The way in is 127th at defending the run, and they are 123rd at hitting chunk plays.
On fourth down he goes for it about as often as his peers do from the same spots (+0.9%). Against what the expected-points model recommends he is −25.4% — the profession as a whole is negative on this.
Nebraska has played 1 game against an average slate, adjusted for here. That football carries about 0% of what is below; the rest is still the preseason projection.
Projected soft spots
- Defenserunning it#127projected
- Offensehitting chunk plays#123projected
- Defensethe push the line gets#122projected
Each bar is where this team sits in the country. Before the season has produced enough football these are PROJECTIONS — last season regressed to the mean, plus talent, returning production, recruiting and whether the staff is the same one — and the season replaces them as it is played. Head coaches only — there is no free feed for coordinators, so on a program where the head coach does not call the offense this describes the staff he hired. Play-calling identity is a style, not a grade: throwing more than the situations warrant is not better than throwing less than they warrant.
2026 Season Projection
model win prob · 9 to playHow the season could finish · 2026 · chance of each final win total · 9 games left
Every remaining game simulated from the model's win probability for it. Tallest bar is the single likeliest finish, not a prediction that it happens.
Player Value
EPA contribution by position group + estimated NIL market value (derived from position rates and on-field production — not actual deal figures).
Total EPA produced by each positional group this season. OL value is captured via the rush/pass efficiency of skill players; OL-specific EPA isn't separately reported.
Estimated from position-group market rates and on-field EPA contribution. Actual NIL valuations depend on social media following, brand fit, and market negotiations — these figures are directional only.
The Five Factors
ranked vs. FBS · bar = betterOpponent-adjusted efficiency
EPA/play vs. schedulePass vs. rush (PPA)
Trenches & disruption
- Line yards (off)
- 3.67#27
- 2nd-level / open-field
- 1.75 / 1.98
- Power / stuff (off)
- 83.3% / 15.0%
- Havoc — total (def)
- 20.6%#39
- Havoc — front 7 / DB
- 7.4% / 13.2%
Standard vs. passing downs
ProPPA on each down type (off vs. def).
Opponent-adjusted by down
Pro| 1st | 2nd | 3rd | |
|---|---|---|---|
| Offense | 0.24#31 | 0.44#35 | 1.16#11 |
| Defense | 0.03#89 | -0.03#44 | 0.41#75 |
Elo Trajectory
Team Fingerprint · 2026 · 43 opponent-adjusted metrics · percentile vs 138 FBS teams
Plot these →Efficiency
- Offense EPA/play0.4982nd
- Defense EPA/play allowed0.1339th
- Offense success rate51%69th
- Defense success rate allowed35%57th
Downs
- Offense success — standard downs49%47th
- Offense success — passing downs58%95th
- Defense success allowed — standard downs49%28th
- Defense success allowed — passing downs12%95th
Explosiveness
- Offense explosiveness1.590th
- Defense explosiveness allowed1.331st
- Offense explosiveness — standard downs1.599th
- Offense explosiveness — passing downs1.626th
Trenches
- Offense line yards3.780th
- Defense line yards allowed3.49th
- Offense highlight yards2.078th
- Defense highlight yards allowed0.5258th
- Offense power success0.8369th
- Defense power success allowed1.023rd
- Offense stuff rate0.1555th
- Defense stuff rate0.1318th
Third down
- Third down conversion60%85th
- Third down distance faced7.428th
- Third down conversion allowed47%26th
- Third down distance forced6.735th
Halves
- Net success rate — first half0.1558th
- Net success rate — second half0.1871st
Drives
- Points per drive4.591st
- Points per drive allowed2.051st
- Average starting field position3064th
- Opponent starting field position2757th
- Available yards gained71%85th
- Available yards allowed42%69th
- Scoring opportunities per drive82%54th
- Scoring opportunities allowed90%33rd
- Points per scoring opportunity5.496th
- Points allowed per opportunity2.264th
- Three-and-out rate9%88th
- Three-and-outs forced30%59th
Roster
- Returning usage39%45th
- Returning EPA14661st
- Team talent composite78785th
- Recruiting class rank88.036th
- Recruiting class points18236th
Every metric is opponent-adjusted and ranked so that higher is always better — a defensive rate that is good when low is ranked accordingly. Sack and tackle-for-loss composition are deliberately absent: their relationship to team quality is a measured null, so they carry a style rather than a rank, and they appear in the pressure signature instead.
Intelligence Report
Offensive DNA
Rush efficiency edge: 0.078 EPA/play
Defensive Identity
Disruption comes primarily from the secondary.
Season Signature
2-0 record through 2 games.
Team Shape · percentile vs. FBS · dashed = 50th
Each axis = national percentile rank. 100th = best in FBS, 0th = worst. Defense and Havoc are oriented so higher = better.
CORE efficiency · situation and opponent removed
Points per 100 plays above average, after the game state is regressed out of every snap and the schedule is solved out across the whole league. The version of this team’s efficiency that can be compared to a team it never played.
What a possession is worth · 11 drives
Play-calling identity
Against what the league calls from the same down, distance, field position, score and clock — so this is the staff, not the game script.
- Pass rate
- 45.7%
- Expected, given the spots
- 43.4%
- Over expected
- +2.3
- Fourth down vs peers
- +12
- Fourth down vs the model
- -33
National Landscape · 2026 FBS · offense vs. defense EPA/play
Each dot = one FBS team. Nebraska is highlighted. Tap or hover a dot for details.
Similar Programs
Teams with the closest offense + defense efficiency profile to Nebraska in 2026


Similarity = normalized Euclidean distance on season offensive and defensive EPA/play. Teams within ±0.02 EPA/play on both units score >90%.
Program Trajectory · CORE rating · 2015–2026 · points per game vs an average FBS team
Program History
recent seasons| Year | Overall | Conf | Win % | xW | Luck |
|---|---|---|---|---|---|
| 2026 | 1-0 | 0-0 | 100% | 1.0 | +0.0 |
| 2025 | 7-6 | 4-5 | 54% | 5.7 | +1.3 |
| 2024 | 7-6 | 3-6 | 54% | 8.1 | -1.1 |
| 2023 | 5-7 | 3-6 | 42% | 8.1 | -3.1 |
| 2022 | 4-8 | 3-6 | 33% | 5.0 | -1.0 |
| 2021 | 3-9 | 1-8 | 25% | 7.6 | -4.6 |
| 2020 | 3-5 | 3-5 | 38% | 3.5 | -0.5 |
| 2019 | 5-7 | 3-6 | 42% | 6.2 | -1.2 |
| 2018 | 4-8 | 3-6 | 33% | 6.8 | -2.8 |
| 2017 | 4-8 | 3-6 | 33% | 3.4 | +0.6 |
xW = expected wins from per-game dominance. Luck = actual − expected (positive = won close games).
1-0 so far, projected to finish 6.9-5.2. Top-four bye in 0.7%. Wins the Big Ten in 0.8%.
If they finish with…
Their chance of making it at each final loss count. Better than even up to 2.
down 0.1 points since preseason — won 49-21 over Ohio against an expected margin of +24, so +4.5 against the number.
- At 3 losses they are 2.4% where the average Big Ten team is 11%.
- The Big Ten takes 3.19 bids in an average season, and four or more in 37%.
Nebraska’s own turning points
Points of playoff probability between winning and losing.
- wk12vs Ohio State18.7
- wk7at Oregon18.1
- wk6vs Indiana14.9
- wk13at Iowa11.6
- wk9vs Washington9.3
- wk10at Illinois8.6
Who to root for
Games Nebraska is not in that move its odds most. Same units, much smaller scale.
- wk2Sacred Heart over Massachusetts0.9
- wk7Texas over Florida0.8
- wk13Michigan over Ohio State0.8
- wk9Northwestern over Oregon0.7
- wk11Boise State over Oregon State0.7
- wk8Auburn over LSU0.7
Big Ten
0-0 in league play, projected 3.9-5.110 of 18 by title oddsThe Big Ten sends its top two by conference winning percentage, head-to-head breaking a tie. The last berth is level on percentage in 50% of simulated seasons, so a tiebreaker decides it about that often.
- wk12Ohio State at Nebraska4.0
- wk7Nebraska at Oregon3.6
- wk6Indiana at Nebraska2.7
- wk13Nebraska at Iowa1.9
Points of title probability riding on each result. The whole Big Ten race →
If not the playoff, then
Nebraska is 1-0 and needs 5 more wins from 11 games to reach the six that make a team eligible — at most one of which may come against an FCS opponent. In 2.1% of seasons they get there and still go nowhere: there are more eligible teams than seats.
- Rate Bowl9.0%
- GameAbove Sports Bowl8.9%
- Pinstripe Bowl8.6%
- Las Vegas Bowl8.1%
- LA Bowl8.1%
- Music City Bowl6.6%
Recruiting Pipelines
since 2010Of the 170 high-school programs with a pipeline page here, 12 have sent Nebraska a player since 2010 — 34 signees between them. Where they signed, not where they were offered, and not a complete list of Nebraska's feeder schools: only these 170 have the outcome history to measure.